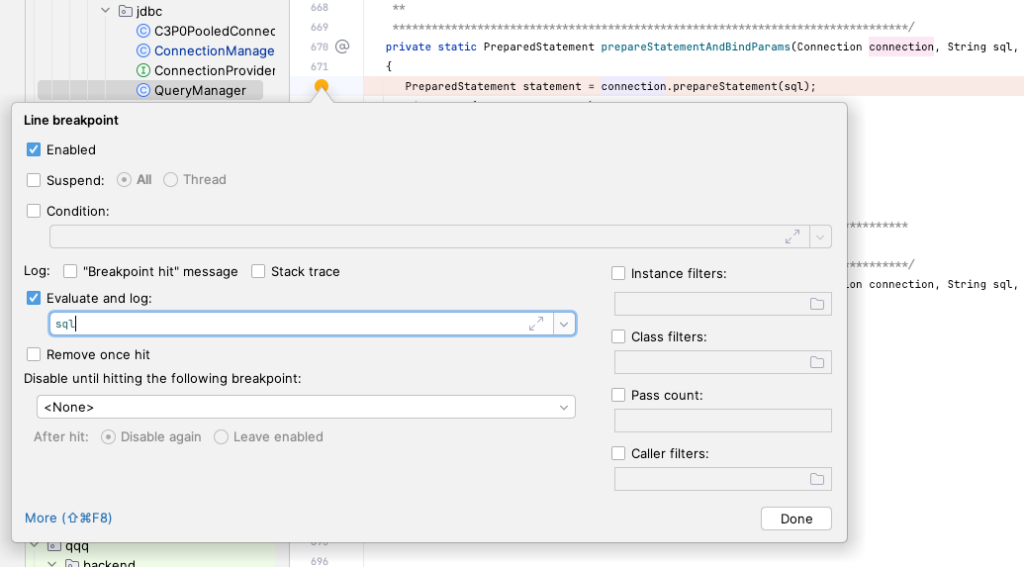
Today I (re)discovered a potentially-quite-useful option in the IntelliJ debugger:
If you go into “More” when right-clicking on a breakpoint, then turn on “Evaluate and log” and enter an expression, it’s basically the equivalent of adding debugging print statements, but without actually dirtying up your code with them. When coupled with un-checking “Suspend” (e.g., making the breakpoint not pause the program’s execution), it’s kinda perfect.

I feel like i should be using this a lot more often!
Makes me wonder what the rest of this screen does. I have used “Disable until hitting the following breakpoint” before, to help avoid the dance of: set a breakpoint; run; break; resume; resume; resume; “is this the context i wanted? no? resume”; resume; resume; “oh crap, i missed the one i wanted! restart!!!“; resume; etc
Ah – TFM: https://www.jetbrains.com/help/idea/using-breakpoints.html


